It’s Time to Leverage Data Like Never Before —Here’s How Business Intelligence Makes It Happen
Picture this: The Younique Foundation, once buried in complex spreadsheets, found a new path with Grow's Business Intelligence platform. It's became a game-changer for them. They transformed their way of working, making a huge difference in supporting women recovering from sexual abuse. This story isn't just about data; it's about how smartly using it can bring hope and change lives.
So, if you ask what is Business Intelligence. It’s safe to say that it turns data into decisions, strategies into actions. Simply put, Business Intelligence is a technology-driven process for analyzing data, providing actionable information to help executives, managers, and other corporate end users make informed business decisions.
So, let's dive in and see how BI tools are reshaping our world, inspired by The Younique Foundation's incredible journey. It's a clear signal: the time to harness data like never before is now.
The Rise of Data as a Key Resource
Historically, businesses relied on conventional methods for decision-making. However, with the advent of BI, the focus has shifted towards data-driven strategies.
Take, for instance, a global retail chain that used BI to optimize its supply chain, resulting in a significant reduction in operational costs. This is how Business Intelligence technologies convert data into strategic assets.
Unpacking Business Intelligence: Tools, Techniques, and Processes
Business Intelligence is an umbrella term that includes various tools, techniques, and processes dedicated to transforming raw data into meaningful insights for business decision-making. Let's delve into the specifics:
1. Detailed Breakdown of BI Tools
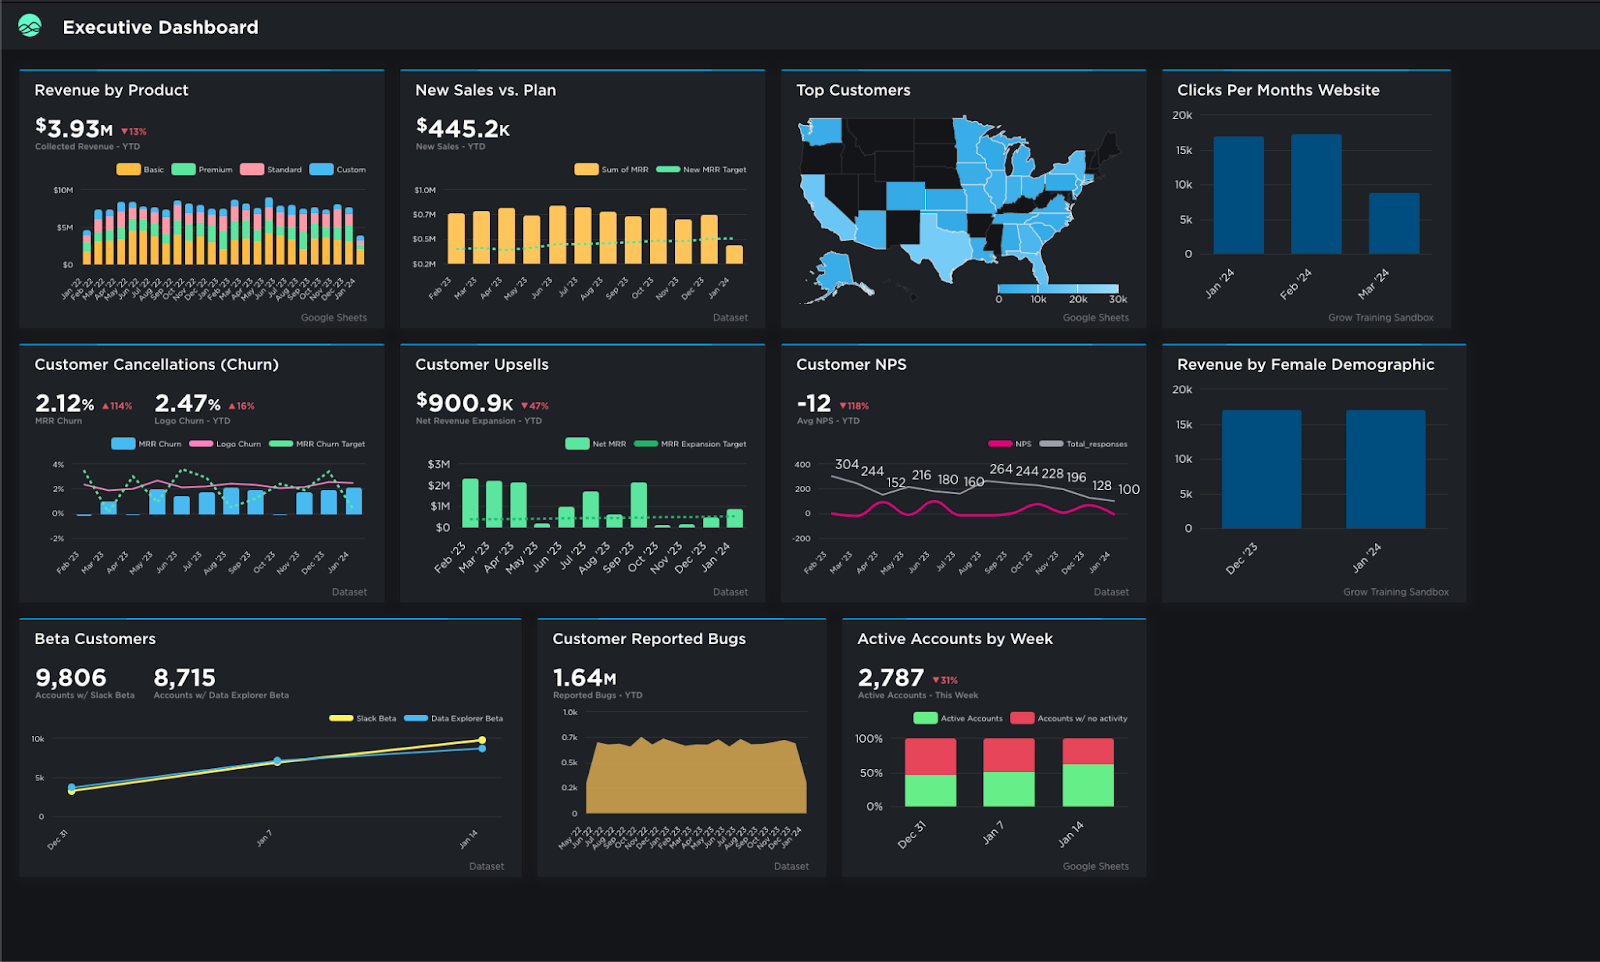
Data Visualization Tools: These are essential in BI for converting complex data sets into graphical representations. They make data more accessible and understandable. For instance, a business intelligence dashboard is a data visualization tool that aggregates and displays key metrics and KPIs in real-time, allowing managers to make quick, informed decisions.
Streamline your strategy and surge ahead with Grow – your command center for real-time insights and market-leading agility.
Analytics Platforms: These platforms are the backbone of what business intelligence is all about. They analyze large amounts of data to uncover hidden patterns, correlations, and other insights.
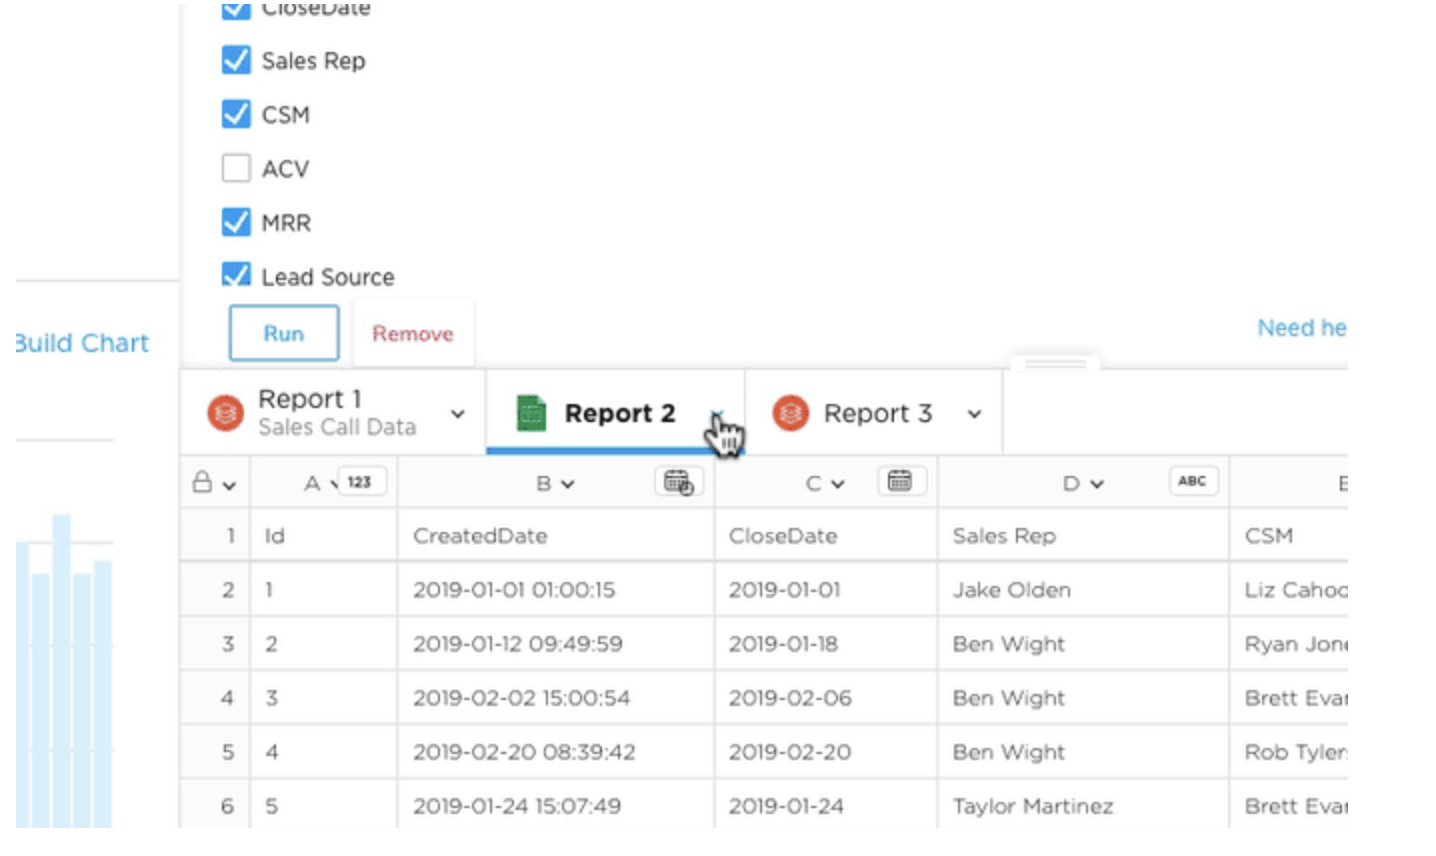
For example, Comapi's switch to the Grow platform showcases the essence of what business intelligence is all about. By implementing this analytics platform, they transformed their data handling from cumbersome spreadsheets to real-time, easy-to-understand dashboards. This move allowed them to quickly analyze vast amounts of data from various sources, uncover hidden patterns and insights, and make proactive business decisions.
2. Techniques Used in BI
Predictive Analytics: This technique uses statistical algorithms and machine learning to identify the likelihood of future outcomes based on historical data.
Suppose, a telecom company uses predictive analytics to identify customers likely to churn. They analyze call quality, billing issues, and customer service interactions to preemptively offer tailored solutions and retain customers.
Data Mining: Data mining involves exploring large data sets to find consistent patterns or systematic relationships between variables. It's a key part of business intelligence technologies, used for segmenting customers, detecting fraud, or identifying potential market opportunities.
Machine Learning: Machine learning in BI is about developing algorithms that can learn and make predictions or decisions based on data. This technique is necessary in modern Business Intelligence trends, where adaptive learning is used to improve the accuracy of insights derived from data continuously.
The most common example is of banks using predictive analytics to assess loan default risks. By analyzing credit scores, repayment histories, and market trends, they make more informed lending decisions.
3. Process Flow: From Data Collection to Insight Generation
Data Collection:
This is the first stage, where data is gathered from various sources like internal databases, social media, IoT devices, etc.
Utilizing Grow's comprehensive integration capabilities, data is seamlessly aggregated from a variety of sources including internal databases, social media, IoT devices, and more, offering a unified view of critical information.
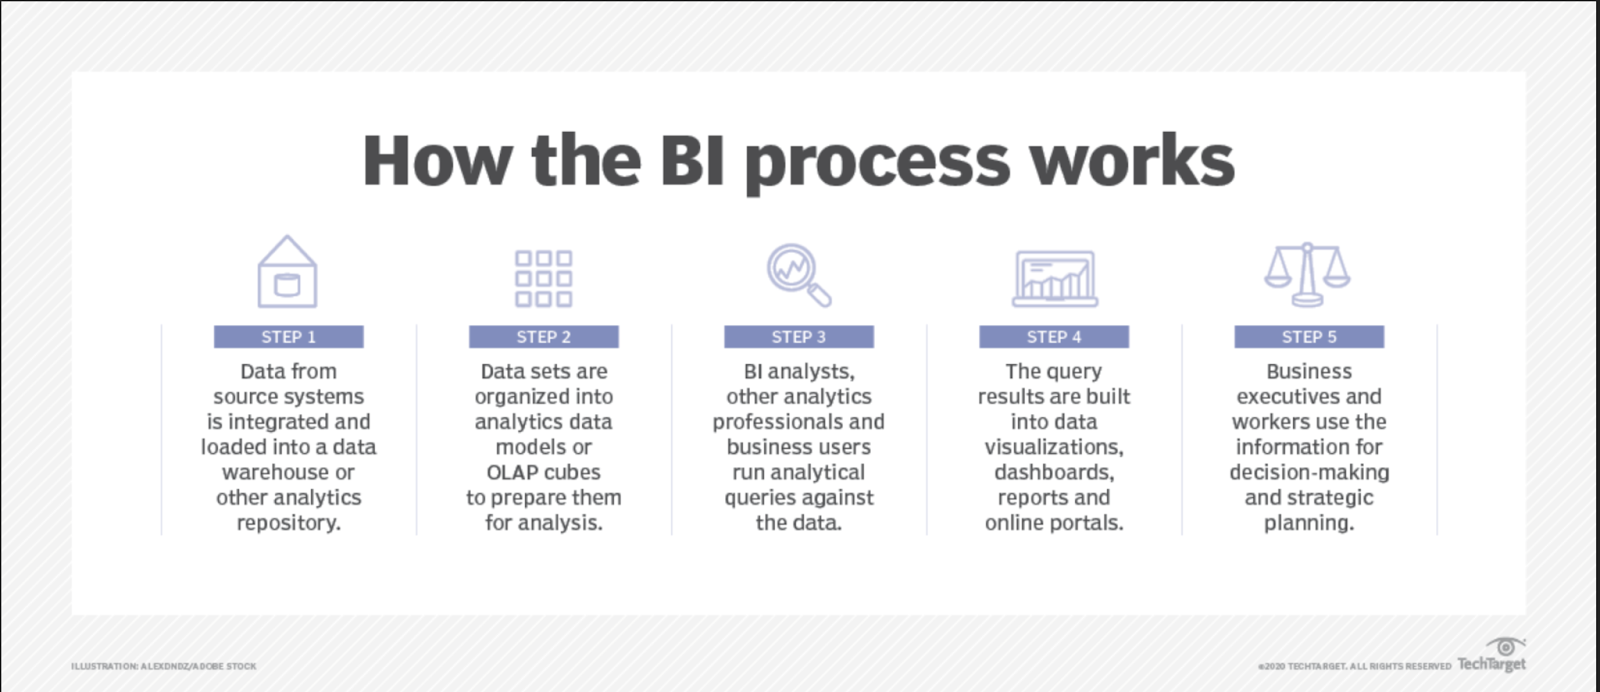
Data Processing and Storage:
The collected data is then cleaned, structured, and stored in data warehouses or lakes, making it ready for analysis.
Grow simplifies the organization and structuring of collected data. With its robust processing power, data is efficiently cleaned and stored, ensuring it’s primed for analysis without the need for complex IT infrastructure.
Data Analysis and Interpretation:
Using various BI tools and techniques, this data is then analyzed to extract meaningful insights. This is where the business intelligence dashboard plays a critical role, providing a user-friendly interface to interact with complex data sets.
Grow's BI tools come into play here, analyzing data with advanced techniques to draw out deep insights. The platform's user-friendly interface on the business intelligence dashboard allows for complex data interaction, making analysis both accessible and interpretable to all business users.
Insight Generation and Decision Making:
The final stage is where insights are translated into actionable business decisions or strategies. For instance, insights from a business intelligence dashboard might indicate a rising trend in a particular product category, prompting the marketing team to focus their efforts on that area.
In the crucial phase of insight generation, Grow's dashboards enable businesses to identify trends and patterns, translating them into actionable strategies. For example, as with Altaworx, insights gleaned from Grow's dashboard revealed a best-selling product's low-profit margin, leading to a strategic shift towards promoting more profitable items — a move that significantly enhanced their revenue stream.
Conclusion
Business Intelligence technologies are challenging the status quo of decision-making with their cutting-edge predictive and proactive approach. From enhancing operational efficiency to predicting future trends, BI empowers businesses to harness the true potential of their data. As the landscape evolves, staying abreast of Business Intelligence trends and continuously optimizing BI strategies will be key to maintaining a competitive edge.
Why wait to transform your data into decisive power? Start with Grow’s 14-day free trial and explore the intuitive, customizable dashboards that make data analysis accessible and actionable for your dynamic business needs.
And for added confidence, see how Grow stands out in the market by reading the latest Grow.com Reviews & Ratings 2023 on TrustRadius. It’s your time to leverage the power of Business Intelligence with Grow and make data-driven success a reality for your business.


Comments
Post a Comment